Dark Balance Chart

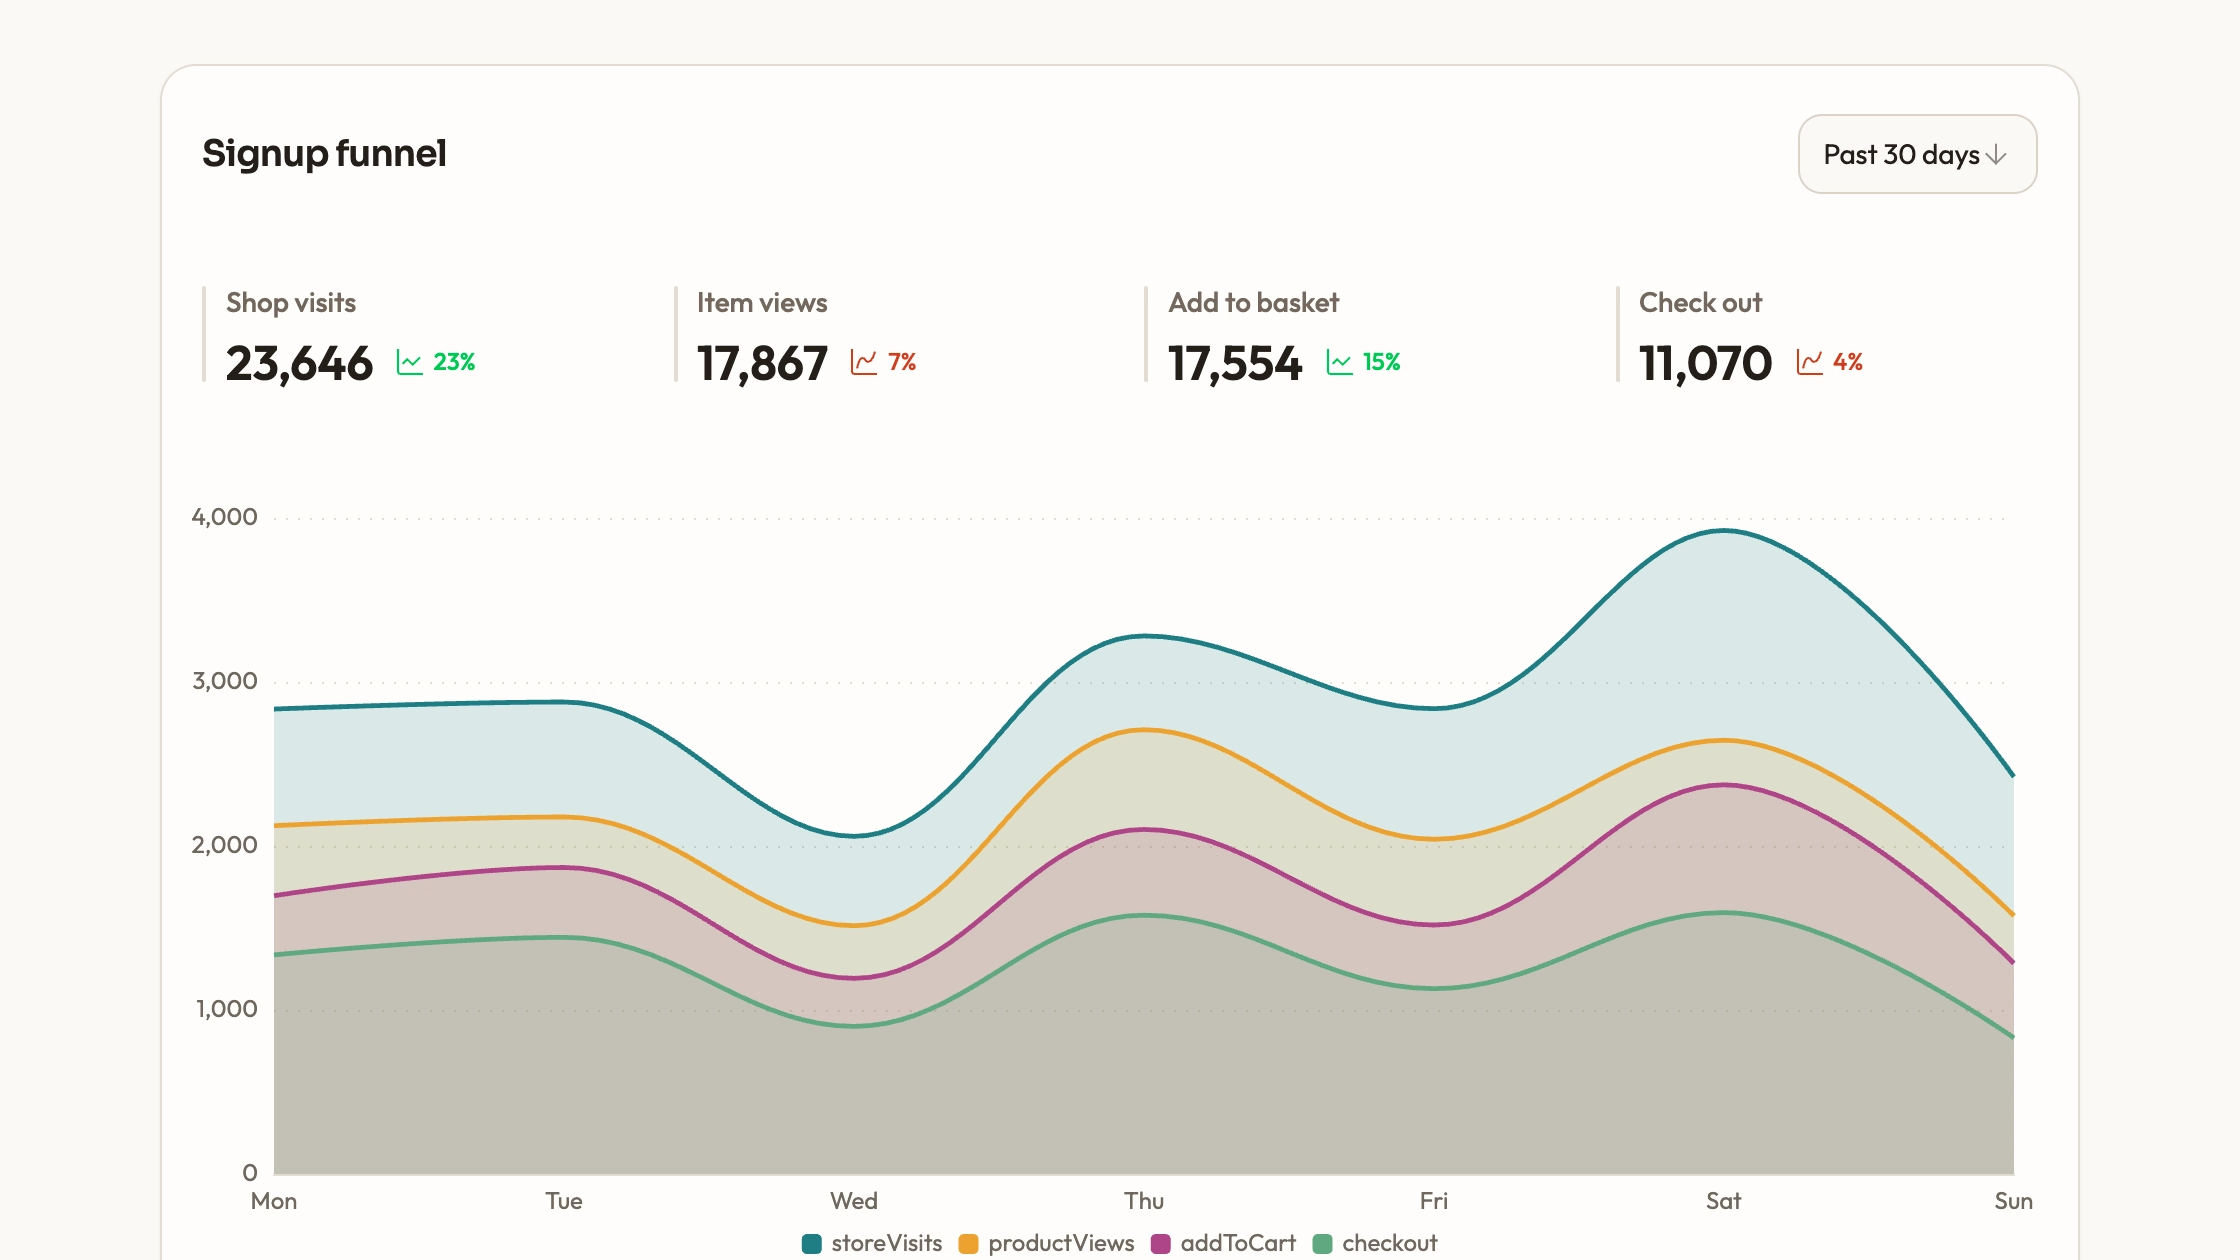
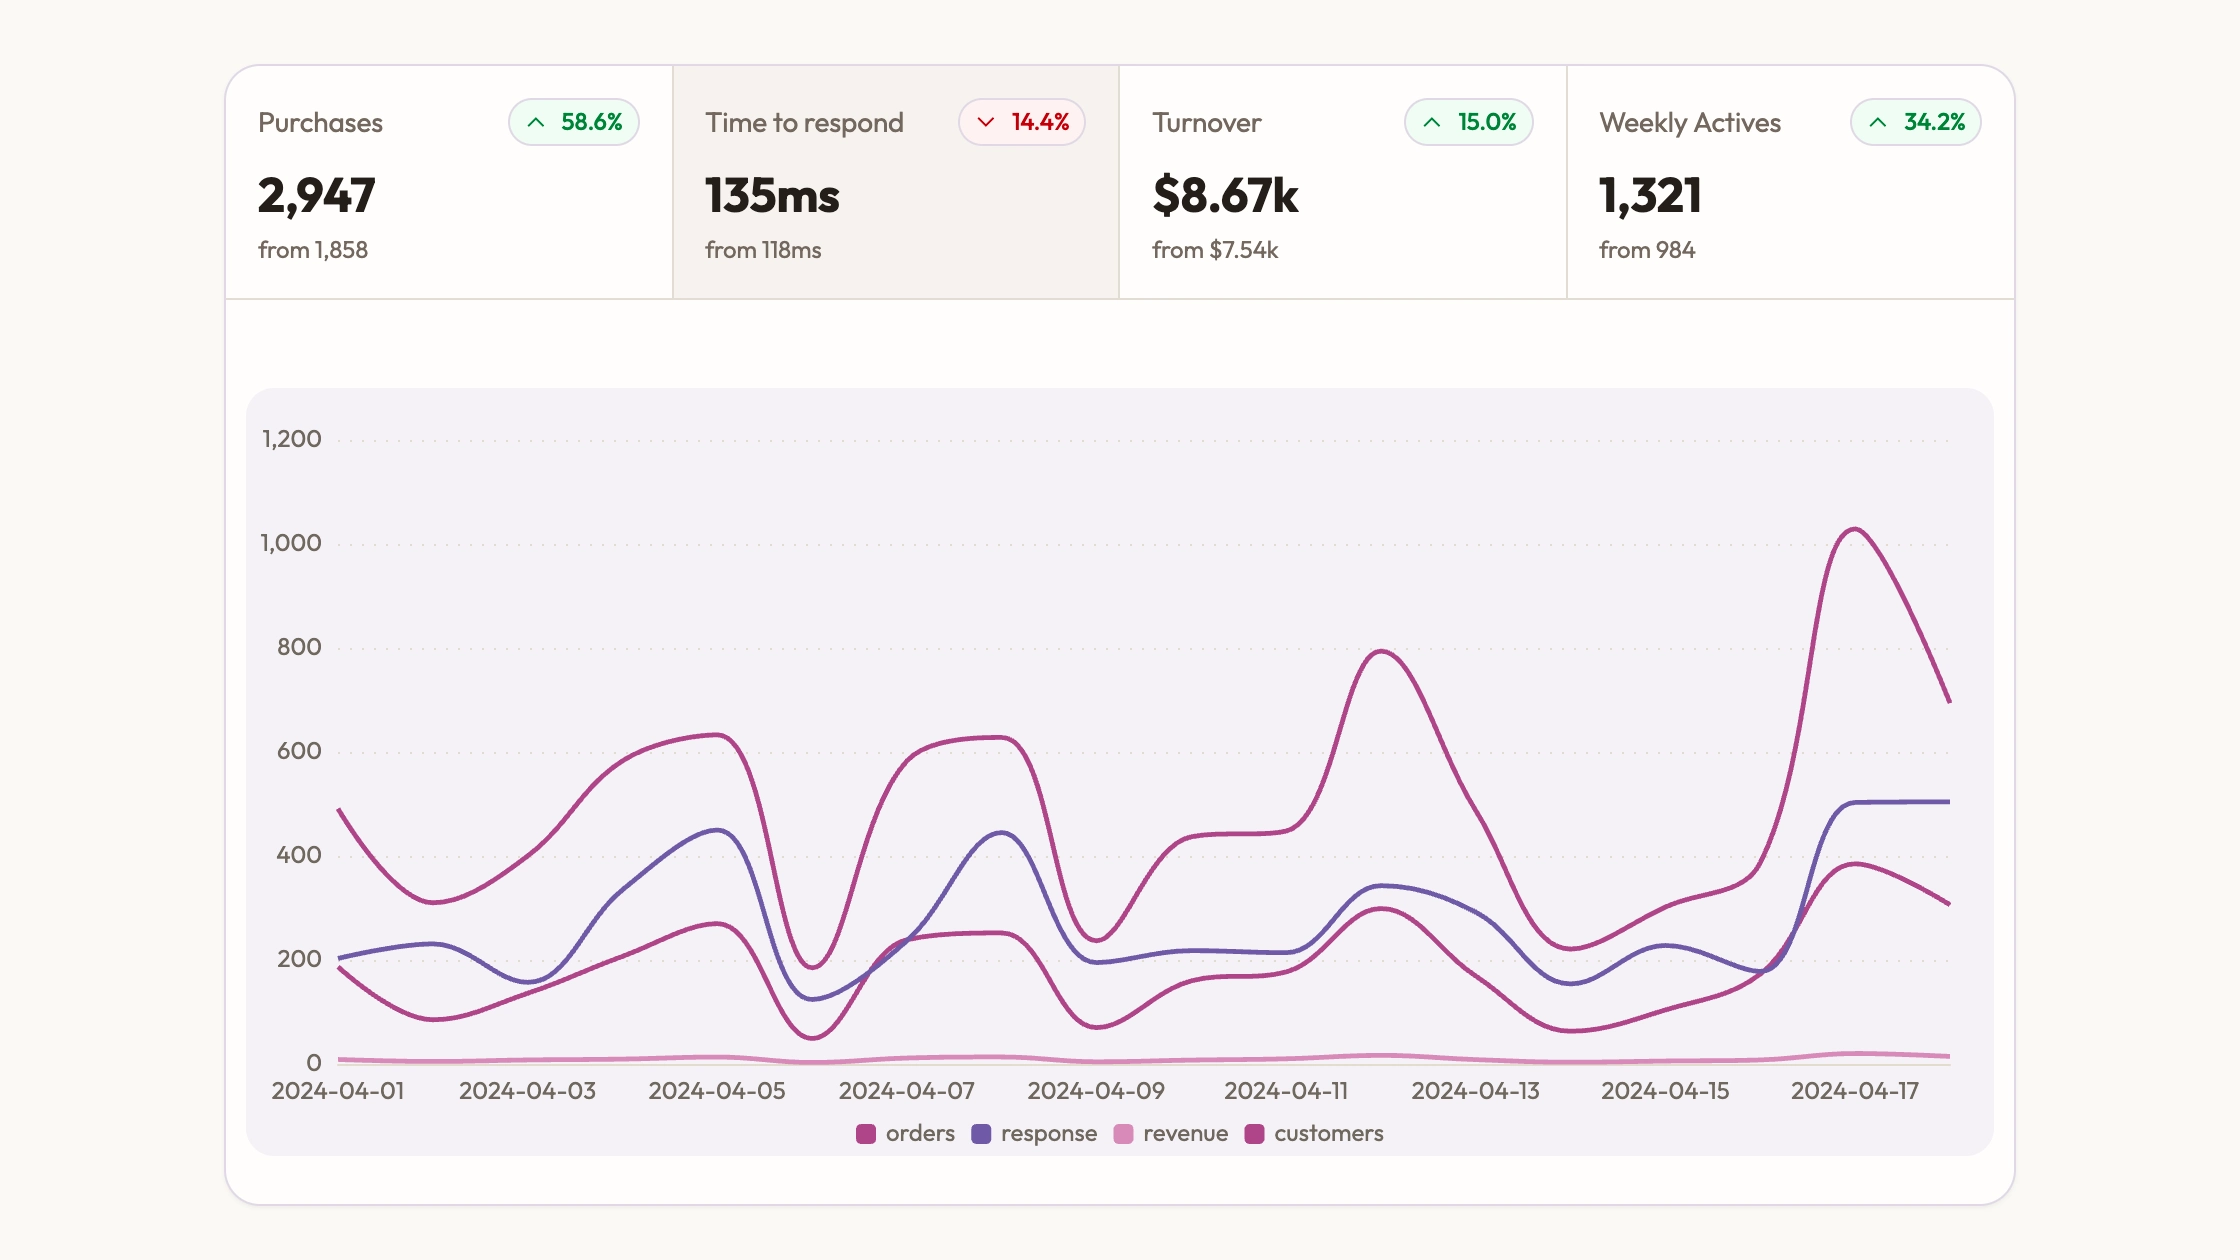
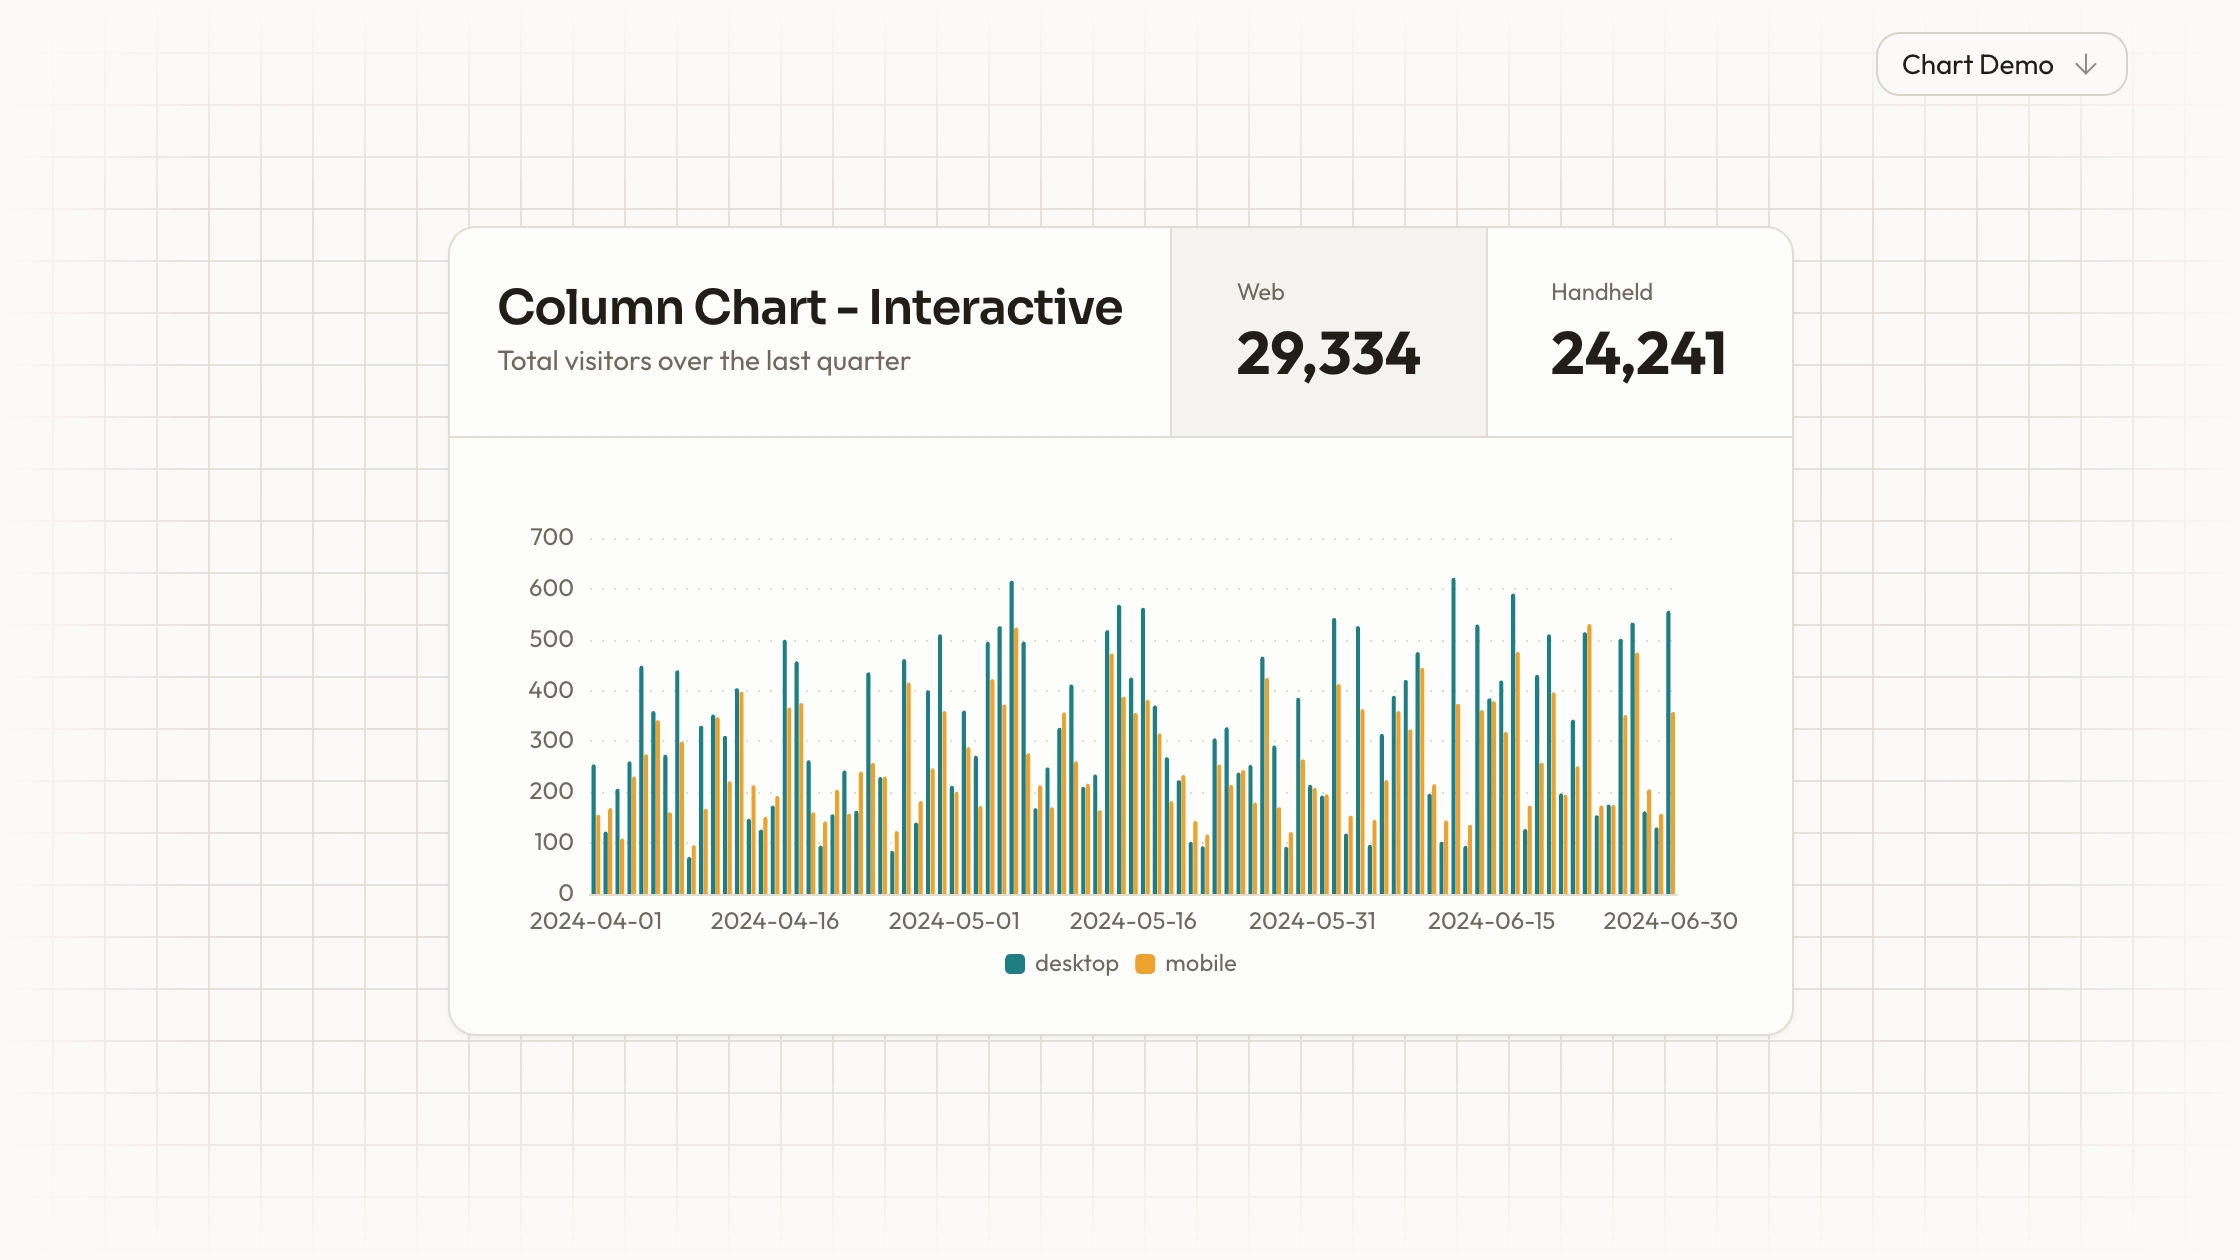
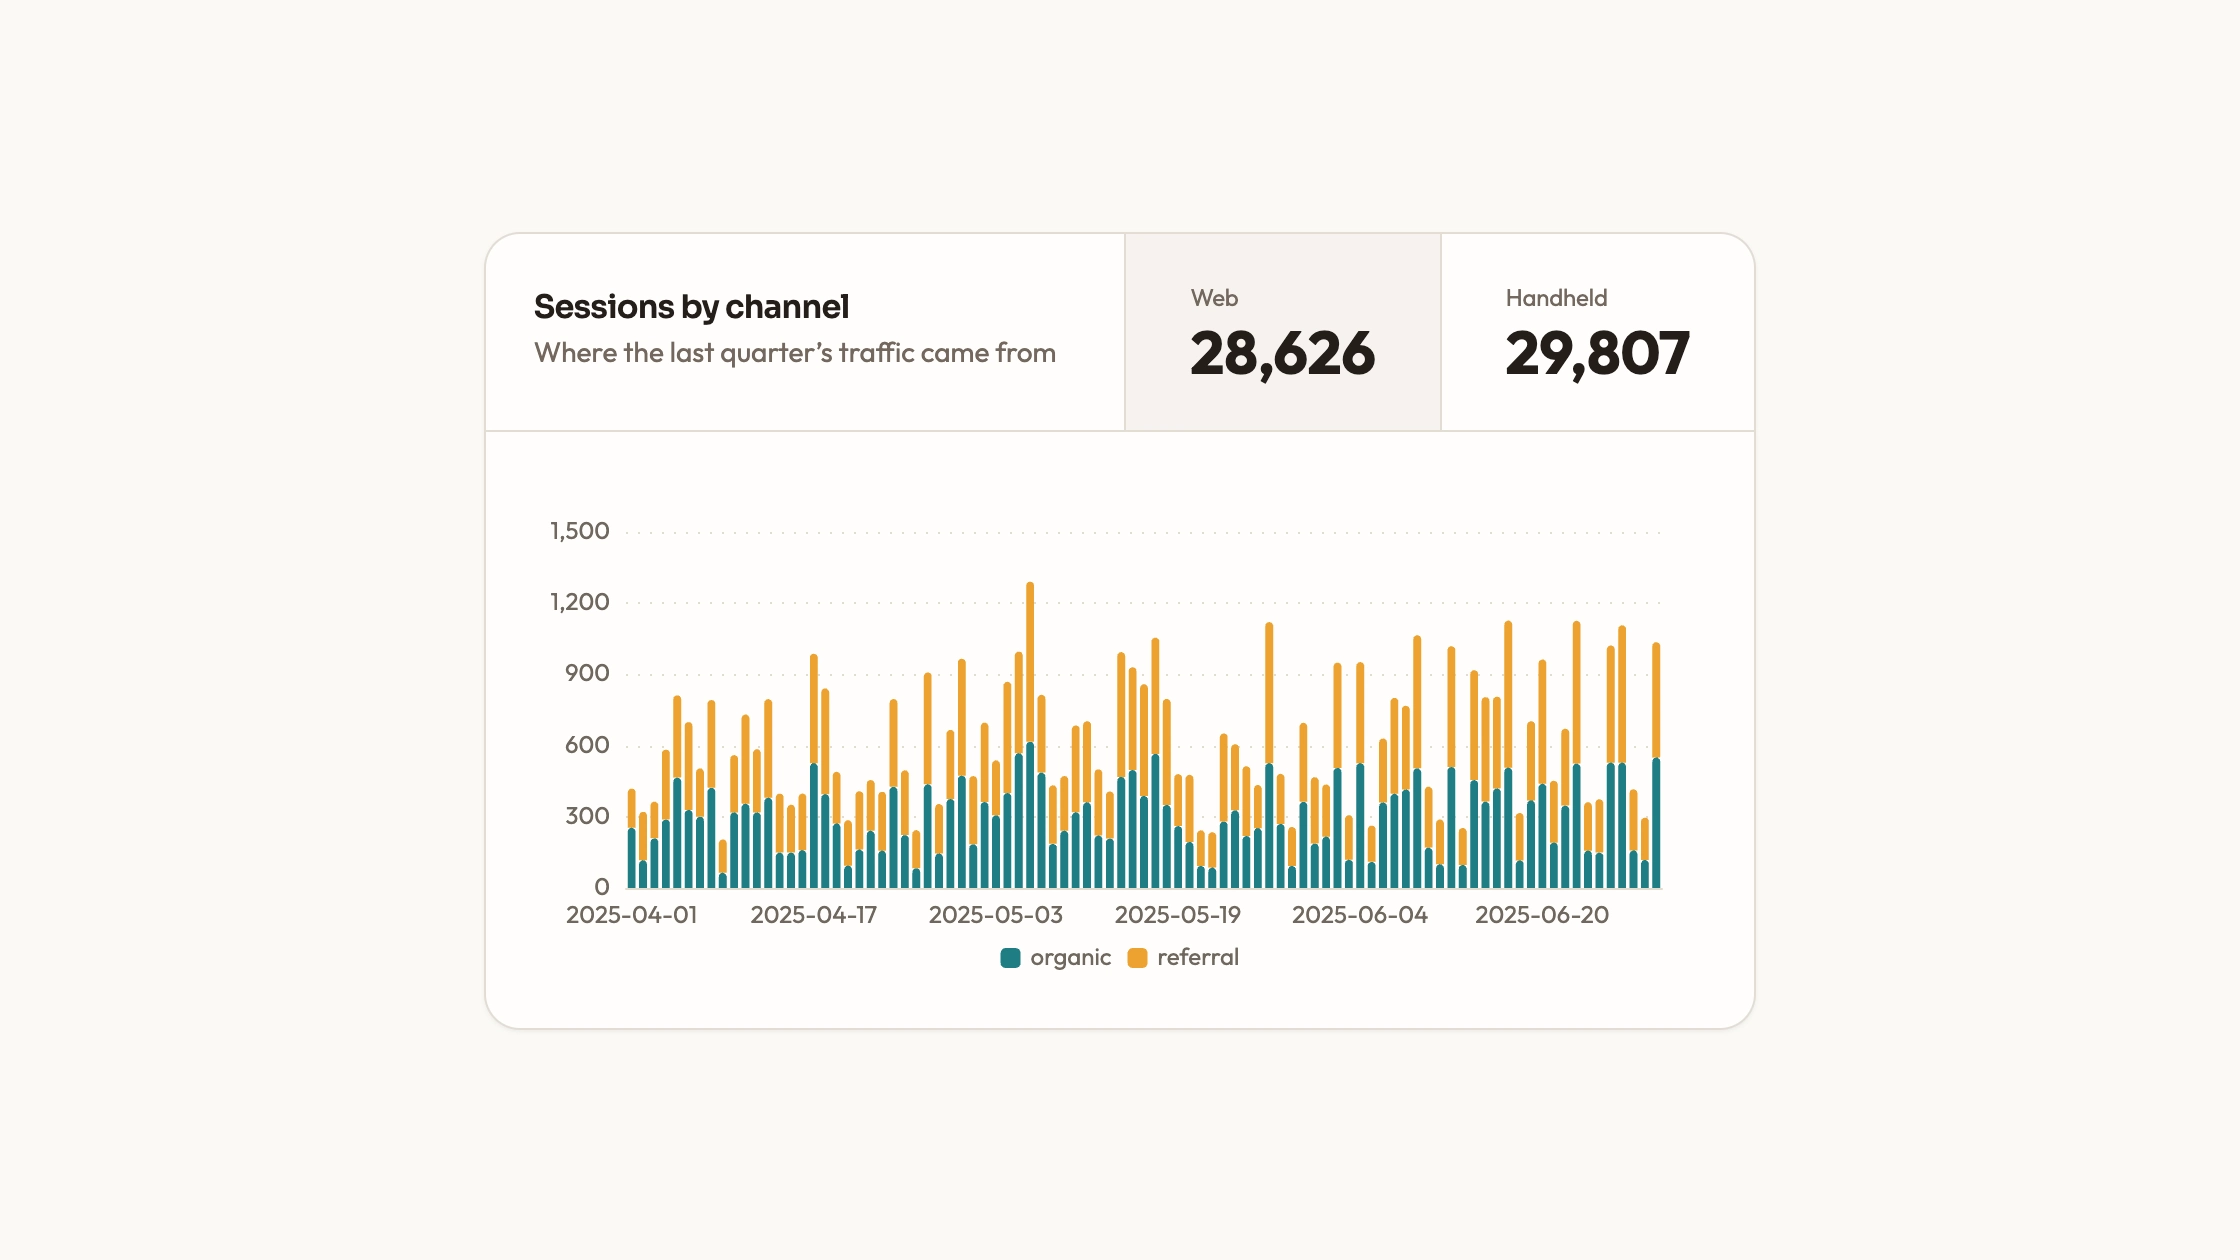
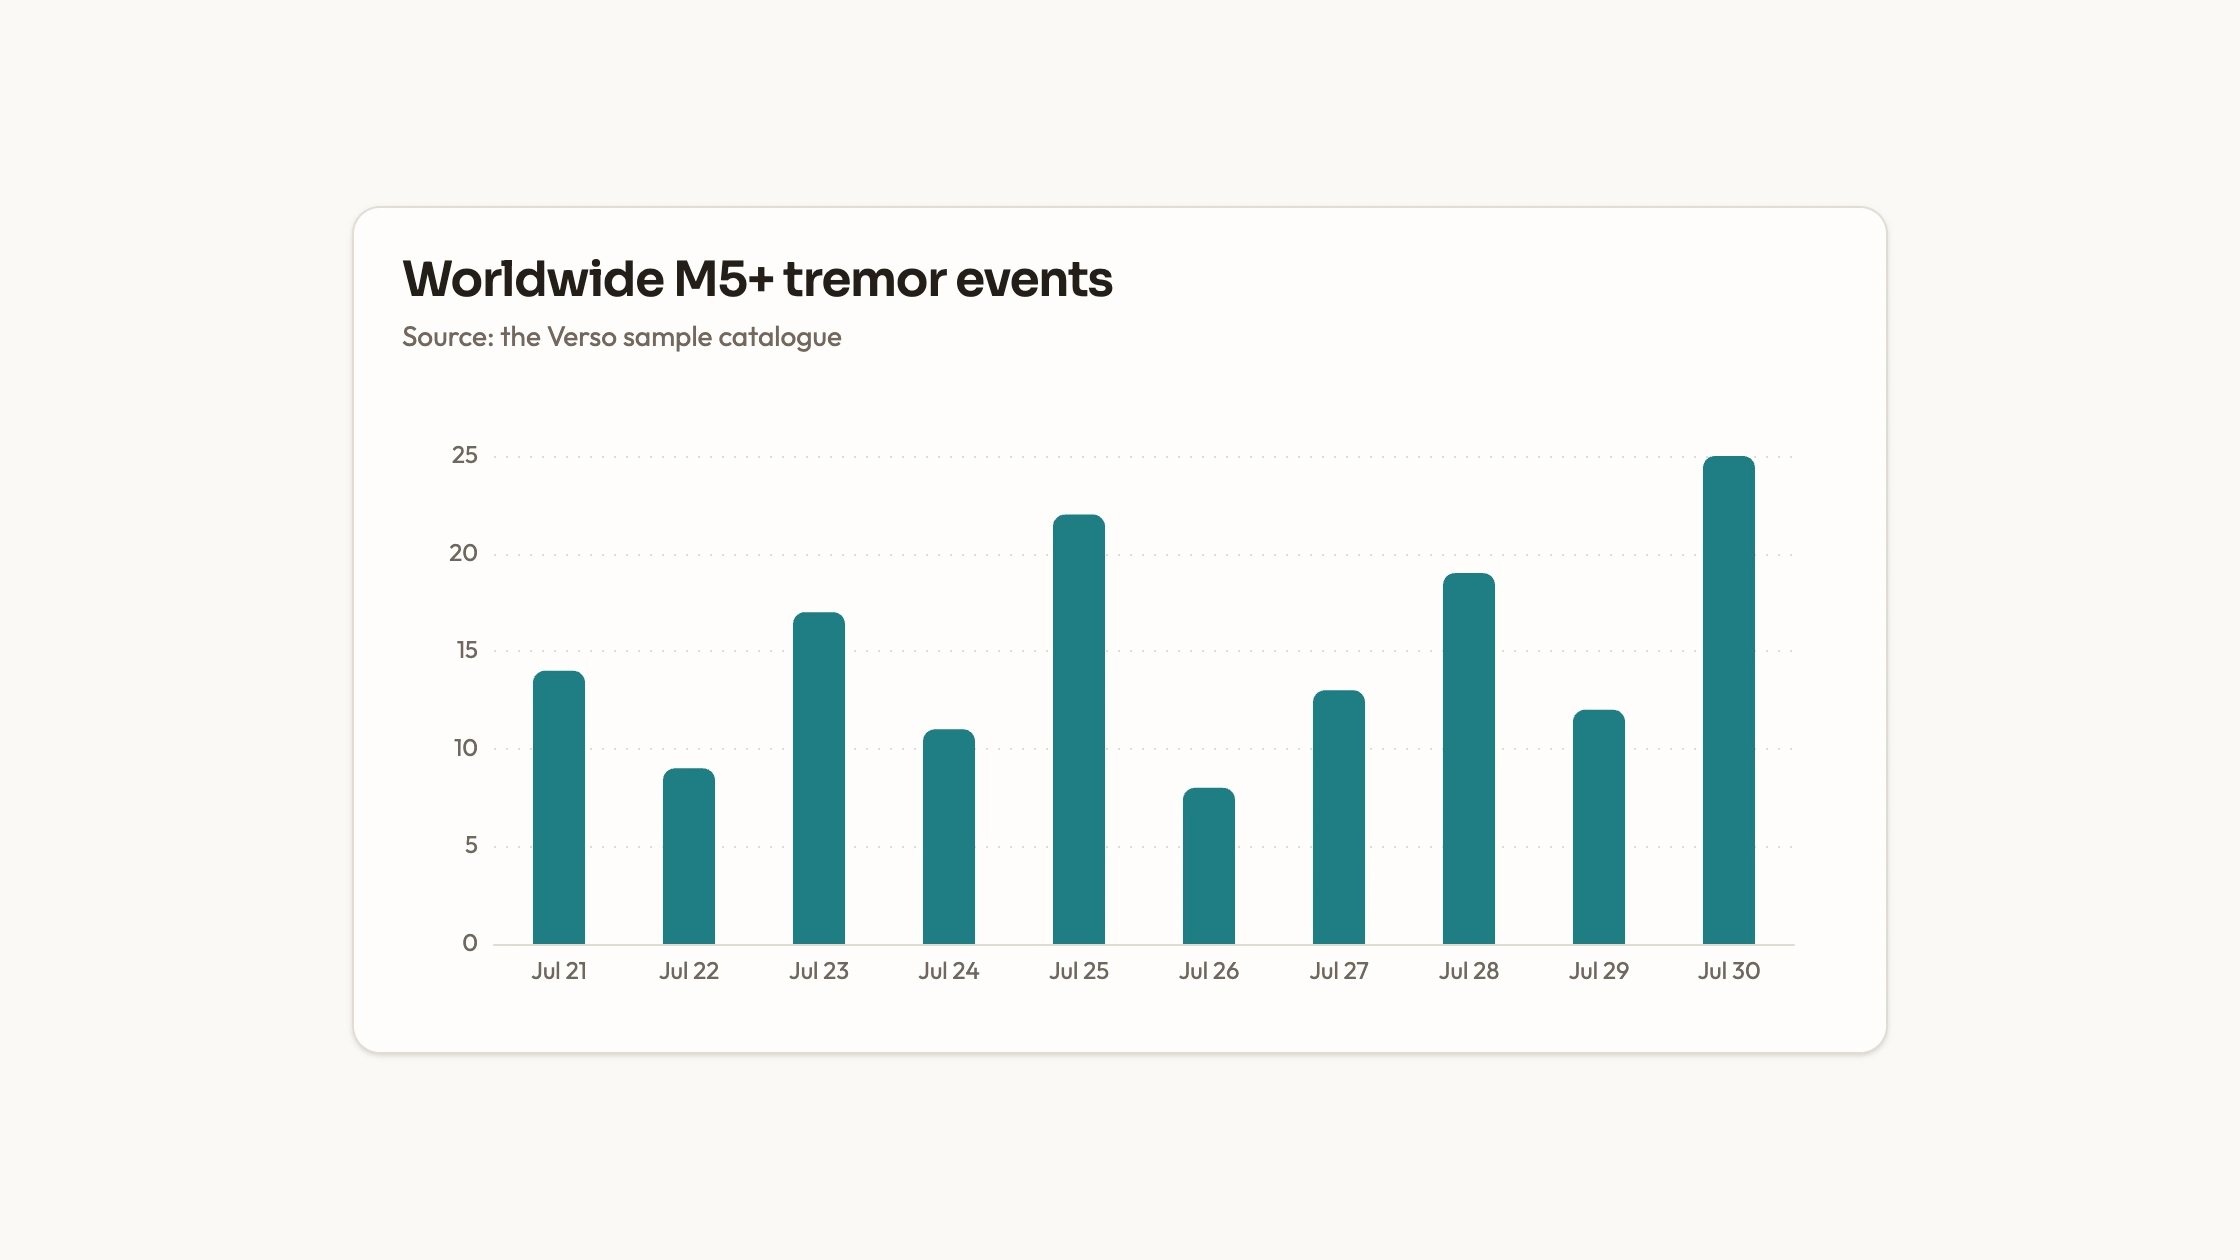
Place a dated value trend inside your page with editable chart configuration and a restrained visual style. Dark Balance Chart includes a canvas-rendered ECharts line panel with axis-hover details and resize handling. The package also contains a separate balance-card example, so choosing which implementation to integrate is part of the setup.

What you get

  • An ECharts React panel containing category dates and a smooth value series in a plain option object. It uses a warm amber palette, dotted horizontal grid lines, an axis-triggered tooltip and a transparent background.
  • Canvas chart rendering without a separate WebGL engine. A ResizeObserver resizes the panel with its container, and cleanup disposes the chart instance. The component has a minimum height and accepts a className for placement.
  • A separate Recharts balance-card example with headline balance, daily change, peak/trough labels, a selected reference date and custom hover formatting. This is an alternate example, not the usage entry for the ECharts panel.
  • Editable component files and a visual contract covering palette, type, radius, icons and motion. Series and category labels remain data-shaped configuration that can be replaced, with project adaptation and local-asset guidance.

Before you choose

Choose this for a compact magnitude trend over labeled observations. Before styling it, define whether the value means balance, revenue or another measure and which period it covers. Then check that the line, axis, hover value and any summary all describe the same unit; a polished financial card is misleading if those values disagree.
Good fit

  • A page that needs a compact dated trend and where the included ECharts setup can save the initial configuration work.
  • A developer who wants direct control over the series, axis labels and chart palette instead of a separate wrapper API.
  • A project willing to maintain the source and its chart-library dependency and to reconcile the chart style with nearby content.

Not for

  • A maintenance-free or dependency-free chart package. ECharts is required for the panel; the alternate card uses Recharts and project UI helpers.
  • A chart that automatically adopts a mature design system without token and label review.
  • Live-streaming analytics, virtualization over very large datasets or an automatic connection to account balances.

How to use

You say/data-visualization-balance-chart Add the Dark Balance Chart component to my dashboard using the data I provide. Inspect the existing page and framework before integrating it; ask for missing data rather than inventing values.
  1. Inspect the target repository and choose the actual implementation before copying files. Use the ECharts panel for the included option-based canvas chart, or deliberately integrate the separate Recharts card with its UI dependencies; do not treat the two as interchangeable imports.

  2. Prepare ordered date labels and a matching value array, with an explicit unit and reporting period. Replace sample numbers, chart title and surrounding copy together. The ECharts panel’s configuration is currently defined in the source rather than exposed as a data prop.

  3. Adjust the option’s palette, fonts, axis styling, tooltip and animation to match the shared visual contract and the page. Keep fonts, imagery and icons local; the chart component itself does not need a hosted data service.

  4. If using the balance-card example, derive its headline and summary statistics from your real data. Its sample tooltip and vertical-axis formatter apply different multipliers, and several percentages are fixed text; reconcile them before displaying financial values.

  5. Check a known point against the underlying record, then test the start/end labels, zero or negative values relevant to your use case and the tooltip’s unit. Resize the actual container down to phone width and check readability, not just whether the canvas resizes. Run the target project’s type/build checks and confirm the expected asset requests.

Requirements and costs

You bring
Not collected yet
Dependencies
ECharts — required
Outside costs
Not collected yet
Publisher testing
v1.0.3 — Claude Code / Claude Desktop / Cowork / Codex / ChatGPT

FAQ

User reviews

—0 reviews

Select a star to share your experience.

No reviews yet. Ratings appear once readers share real experiences.

Similar Skills

View all skills