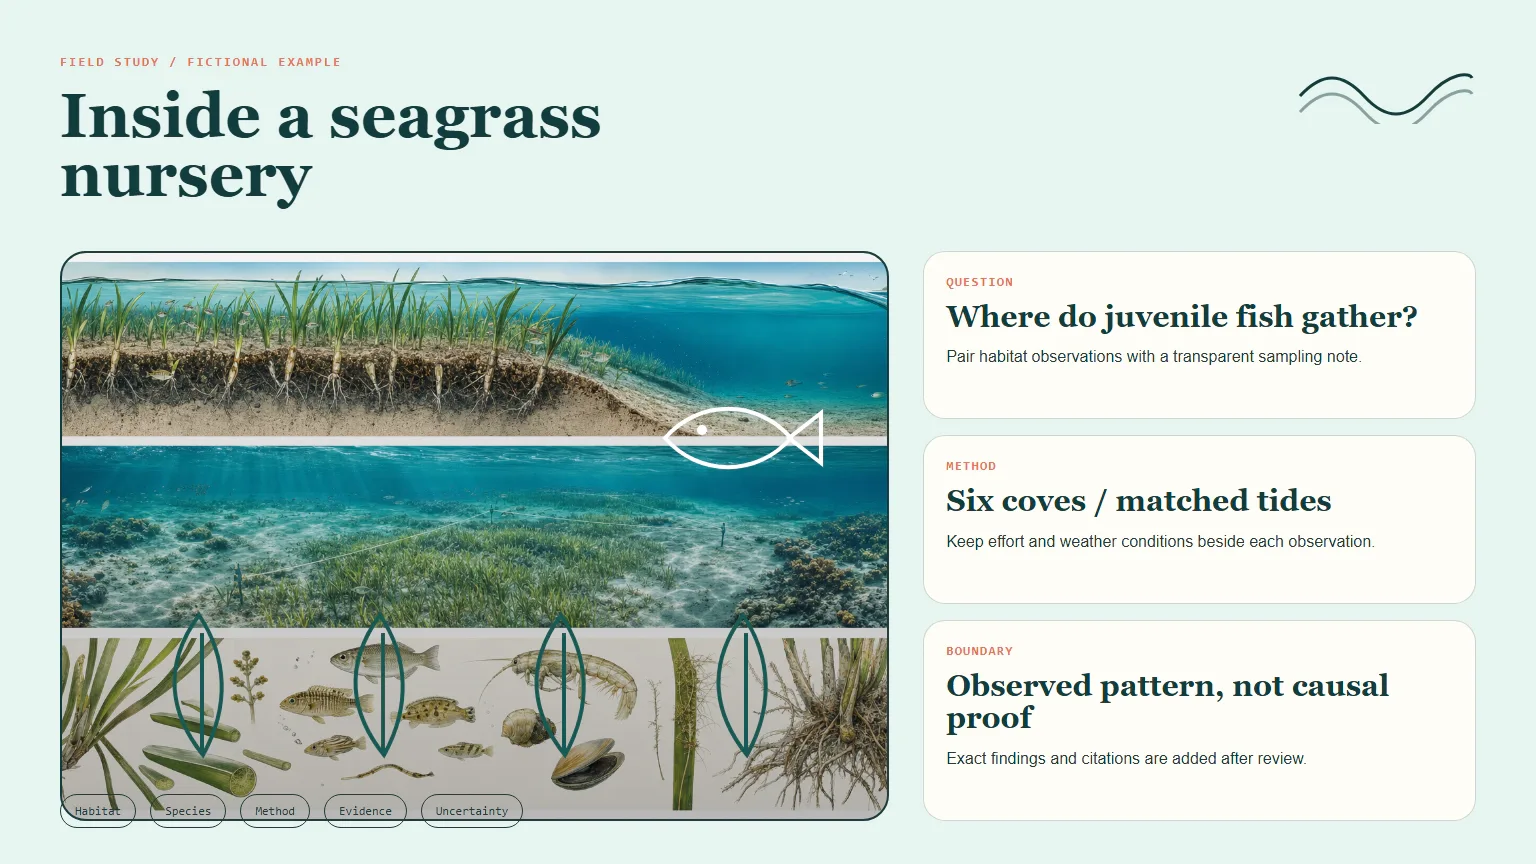
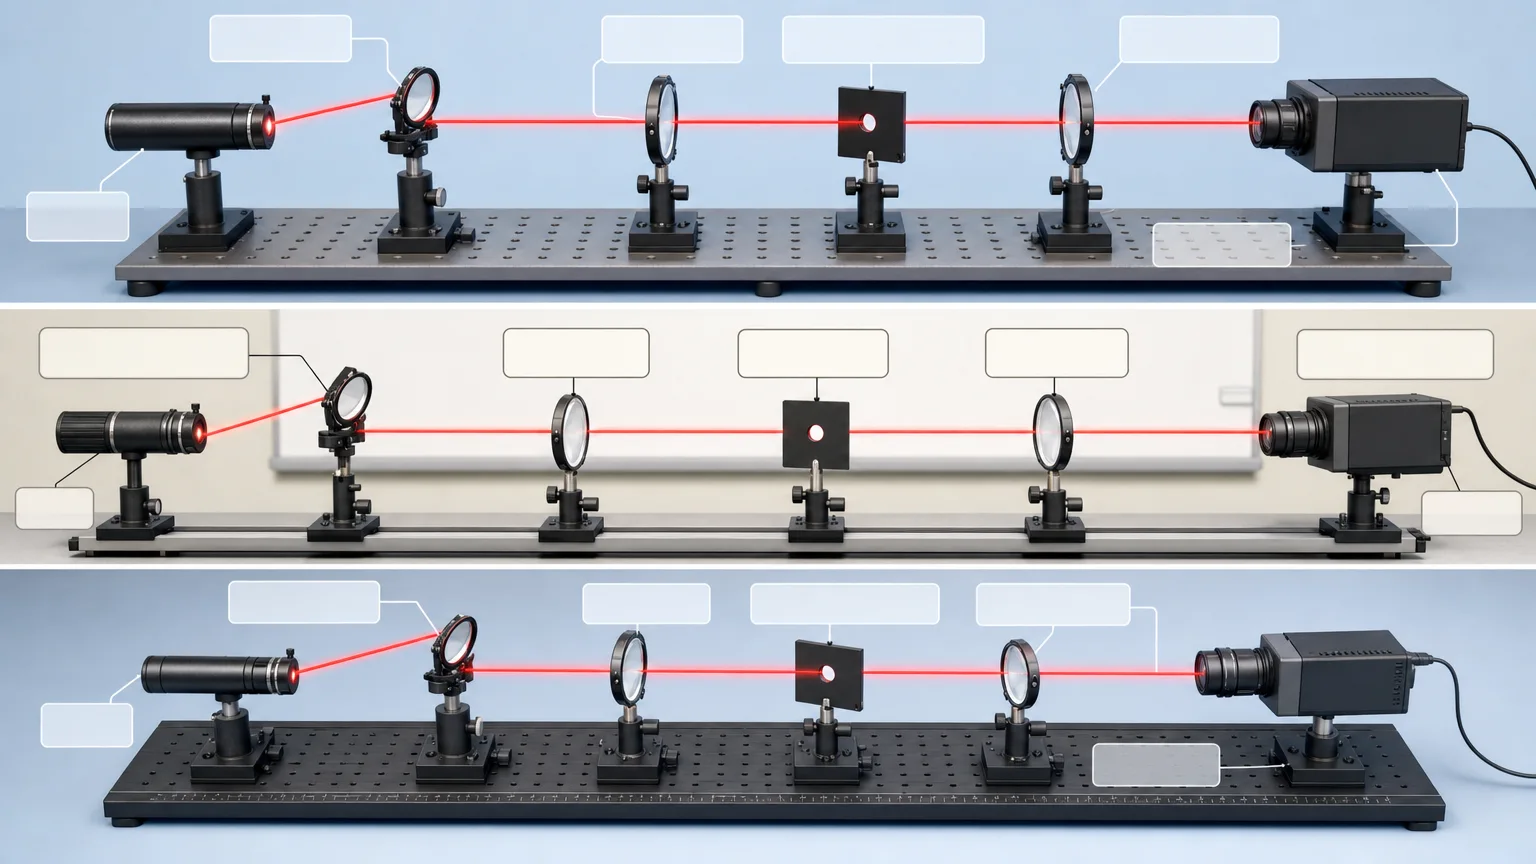
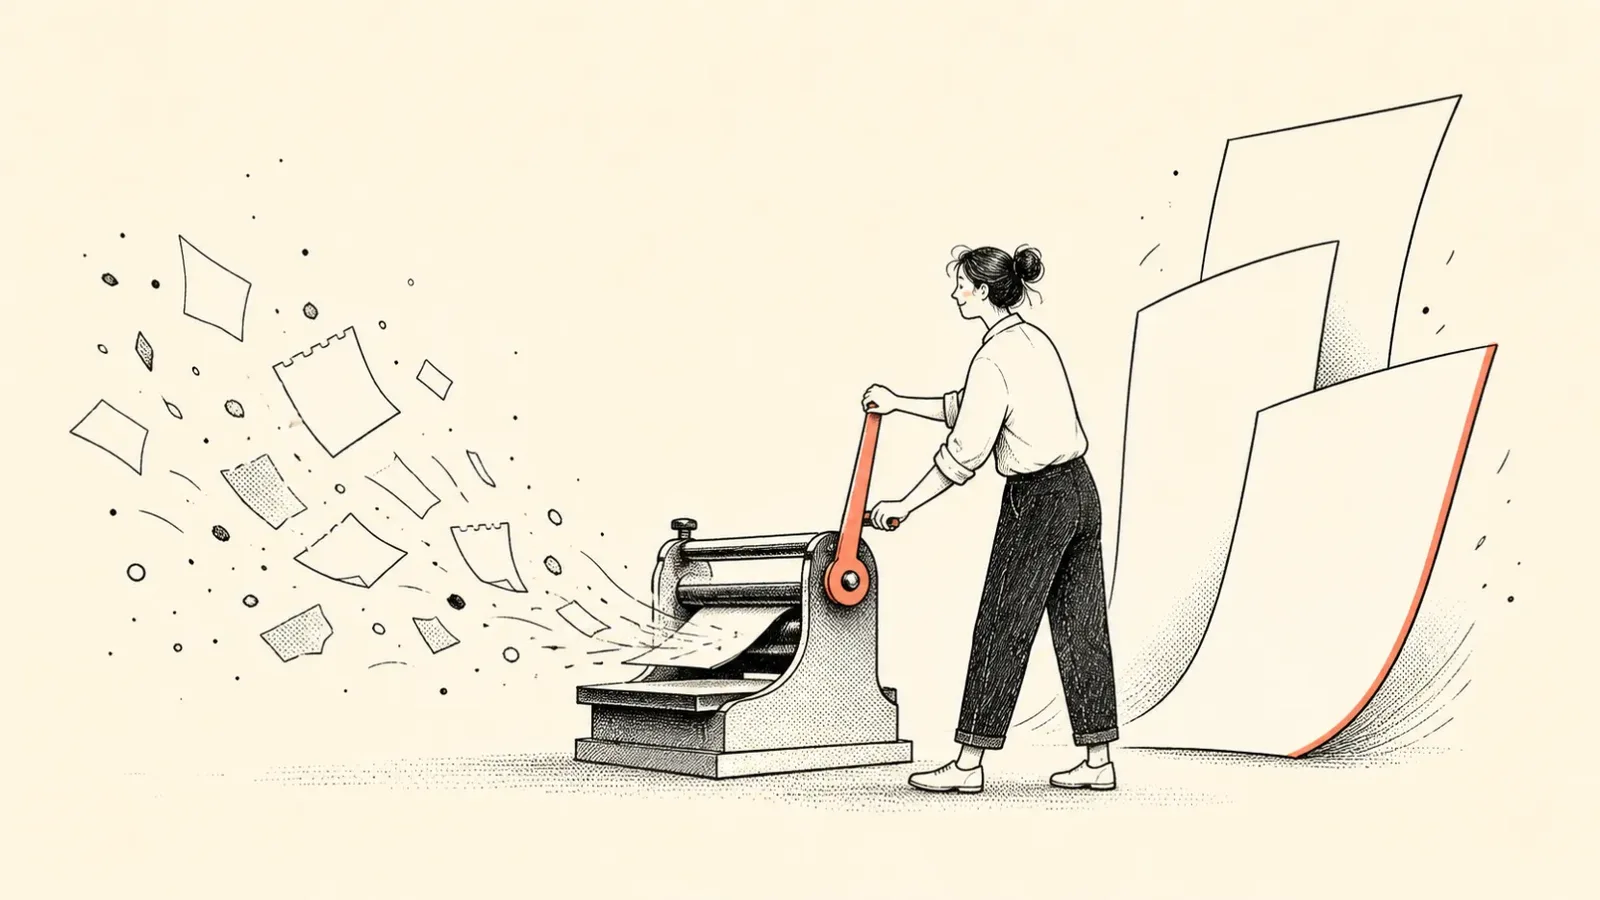
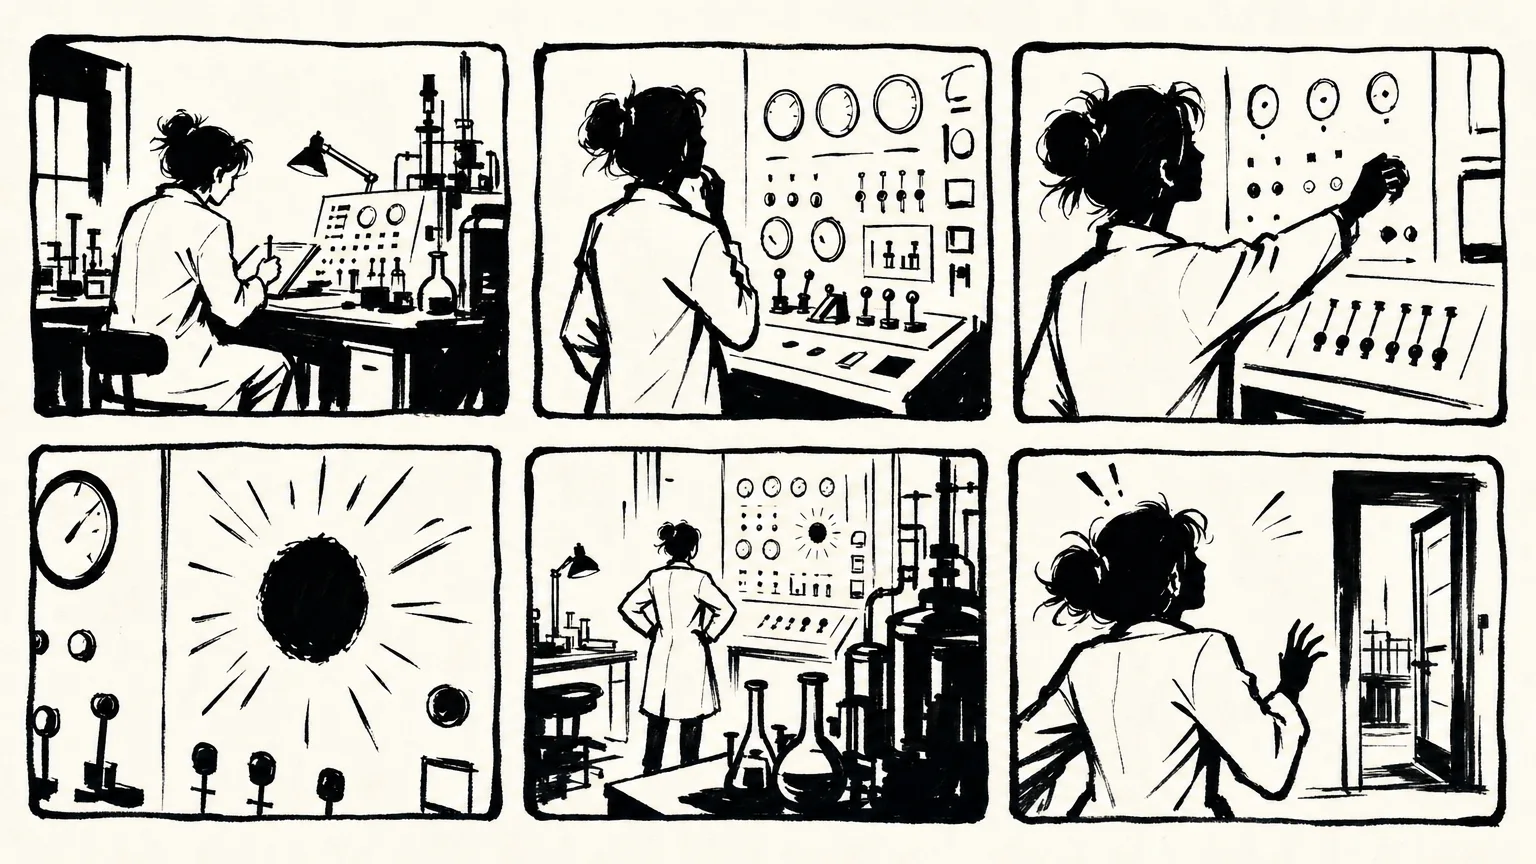
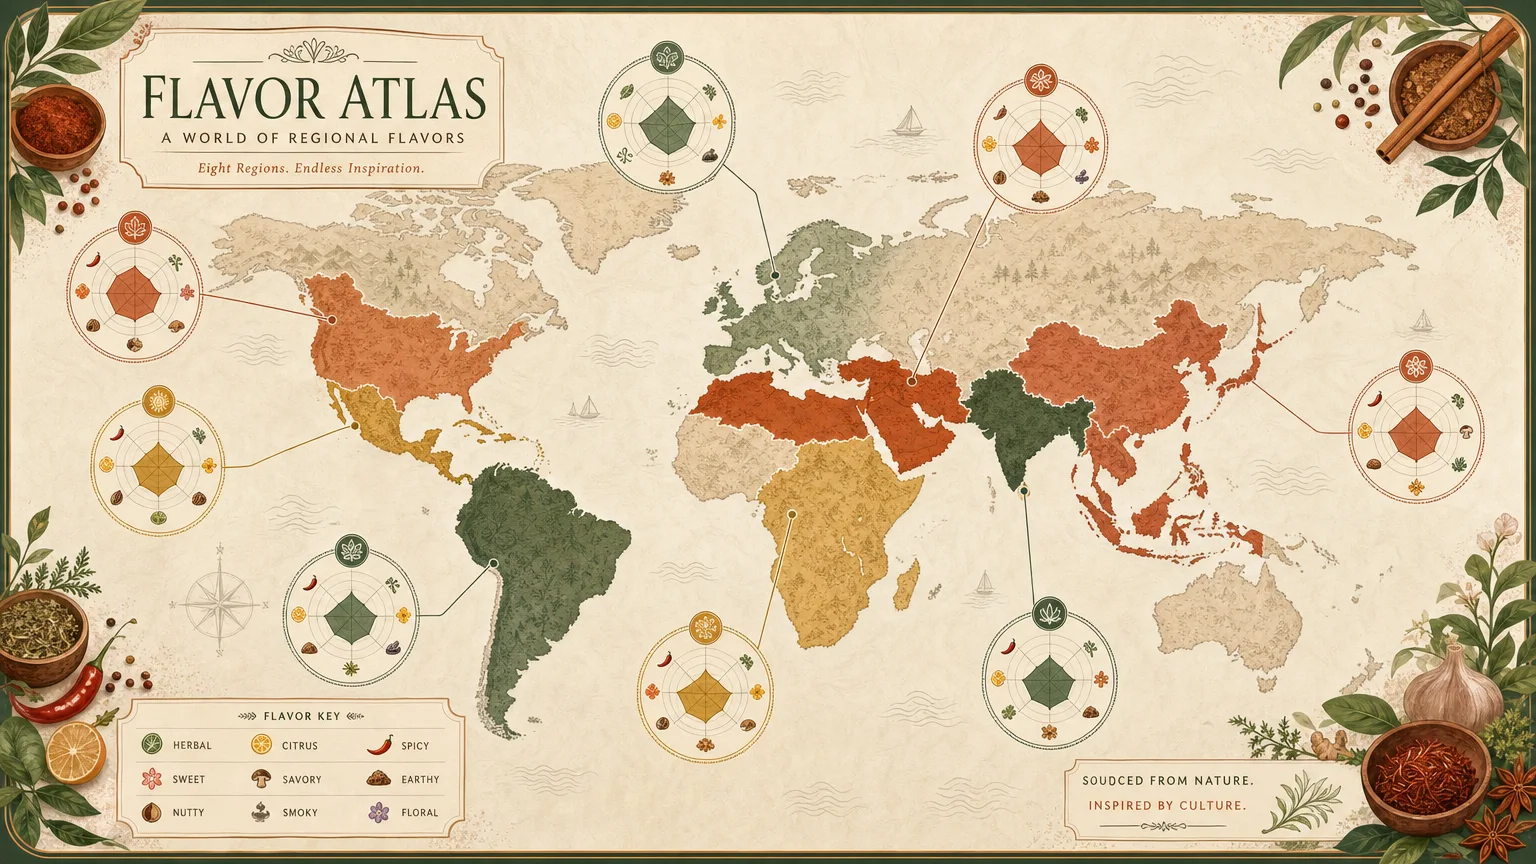
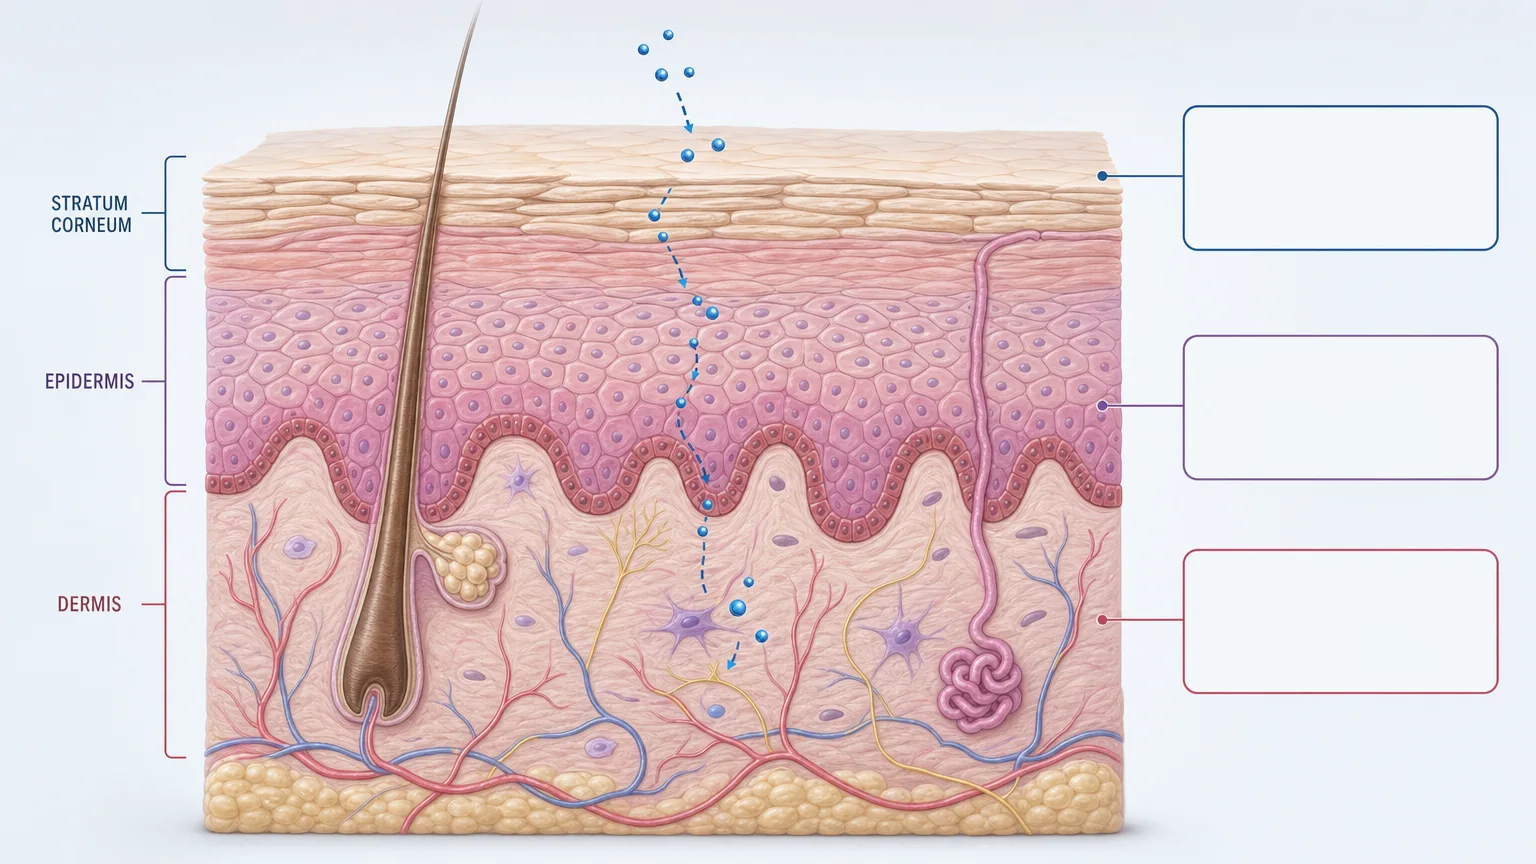
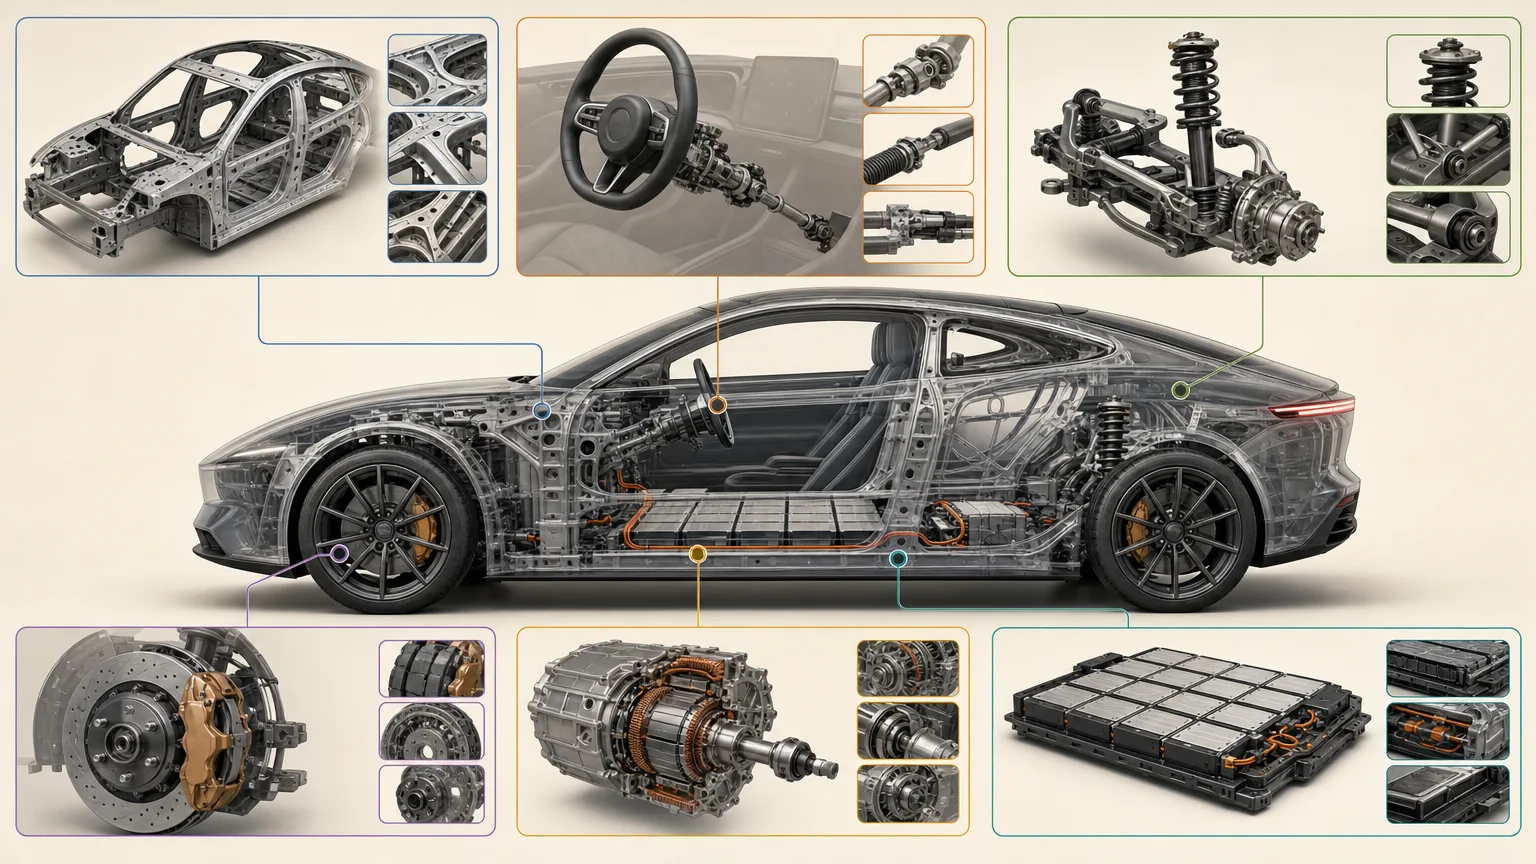
Give one teaching claim a clear visual route through a comparison, timeline, process, card list or data story. Hand-Rendered Explainer combines organic marker lines, restrained color and structured evidence blocks. It creates three alternatives while reserving exact labels and citations for reliable typesetting afterward.
What you get
Three distinct 16:9 explainer alternatives based on one verified brief, with one central teaching claim and three to six supporting facts. The selected layout grammar follows the evidence instead of mixing unrelated structures on one canvas.
An illustration-led reading path using organic marker lines, modest color accents and generous space. Comparison, timeline, process, card list and data story offer different ways to organize the claim; visual connections must stay faithful to the source.
Clean copy/citation zones for exact terms, values, claims and sources added in a deterministic tool after base-image generation. Real data can be used, but chart/relationship accuracy and exact labels need checking rather than being assumed from generated appearance.
A review of hierarchy, factual relationships, reading order, citations and accessibility, excluding copied artist/platform/product expression, source identities, logos and watermarks. Missing facts and permissions remain explicit instead of being guessed.
One paid FAL request for three high-quality 1536×864 PNG variants, with workflow instructions, a saved task record and SVG icon guidance. The script verifies returned count, not actual image ratio, numerical graphics, meaning or distinctness; final annotations and visual/source review complete the output.
Before you choose
Follow the graphic’s path and state the evidence at each step. If the viewer must infer a missing comparison basis or causal link, repair the claim and layout before adding warmth or more illustration. Friendly linework should make supported reasoning easier to read.
Good fit
A lesson or workshop needs a memorable summary around a small number of supported facts.
A research communicator has a focused set of verified findings to explain.
An article would benefit from a warm hand-rendered evidence graphic rather than a dense text layout.
Not for
Invented statistics, causal links, citations or other unsupported claims used to fill the composition.
Exact imitation of a named artist, product or platform visual system.
Dense paragraphs or data labels that must be rendered as tiny model-generated type.
How to use
You say/hand-rendered-explainer Turn my verified urban tree-canopy findings into a 16:9 process-and-data teaching graphic.
Provide verified topic/facts/source notes, audience/teaching goal, preferred structure and exact labels/claims for later typesetting. Resolve essential factual or rights gaps before generation.
Reduce the material to one teaching claim and three to six supporting facts, retaining qualifications that affect meaning. Choose one evidence grammar and plan the reading path; do not invent numbers or connections to make the design more dramatic.
Write a fresh English brief specifying marker-line character, restrained accents, open spacing and blank exact-copy zones. Keep small text out of the request and exclude copied scenes, protected identities, logos and watermarks. Review before the paid task.
Use Node.js 20 or newer with a FAL account and FAL_KEY from the environment. One paid request produces three high-quality 1536×864 PNG variants. The wrapper fixes these dimensions and does not calculate data graphics or verify source facts.
Preserve provider-task.json and the approved prompt. Once the request ID is saved, resume with the same prompt/output directory; recorded failed tasks are not automatically resubmitted. Persistence follows the submit response, so inspect provider history before retrying an uncertain response or failed write. Keep approved copies separate because resumed downloads may overwrite matching filenames.
Compare every alternative with the source for the teaching claim, factual relationships, data geometry, order and hierarchy. Check actual dimensions, distinction and accessibility. Add exact labels/citations with a deterministic tool and use small inline SVG for functional legend/callout cues. Deliver only after the final words and visual relationships have been reviewed.
Requirements and costs
You bring
Verified topic, facts, and source notes · Audience and teaching goal · Preferred structure such as comparison, timeline, process, or data story · Exact labels and claims to typeset after generation
Image generation uses one paid fal.ai task for three variants. Failed tasks are never submitted again automatically.
Publisher testing
v1.0.0 — Claude Code / Claude Desktop / Cowork / Codex / ChatGPT
FAQ
Yes, when verified values and sources are supplied. Reserve space for exact labels and add them after generation. Check the plotted relationships, quantities and scale too; the wrapper does not validate a chart because its labels are correct.
Choose one comparison, timeline, process, card-list or data-story structure that fits the evidence. One main claim and three to six supporting facts keep the result focused. These are composition instructions, not a bundled editable charting application.
The workflow develops a new composition from broad marker-line/spacing traits and your approved content, excluding copied artist, product or platform expression. Actual results still need originality/rights review. FAL_KEY and Node.js 20+ support a paid three-variant request.
User reviews
—0 reviews
Select a star to share your experience.
No reviews yet. Ratings appear once readers share real experiences.