Compare sourced regional flavor profiles without presenting subjective scores as universal facts. Regional Flavor Map combines a restrained geographic overview with mini-profile charts on one shared scale. Region identifiers, methods, dates, sources and uncertainty guide the composition; missing or incomparable data stays explicit.
What you get
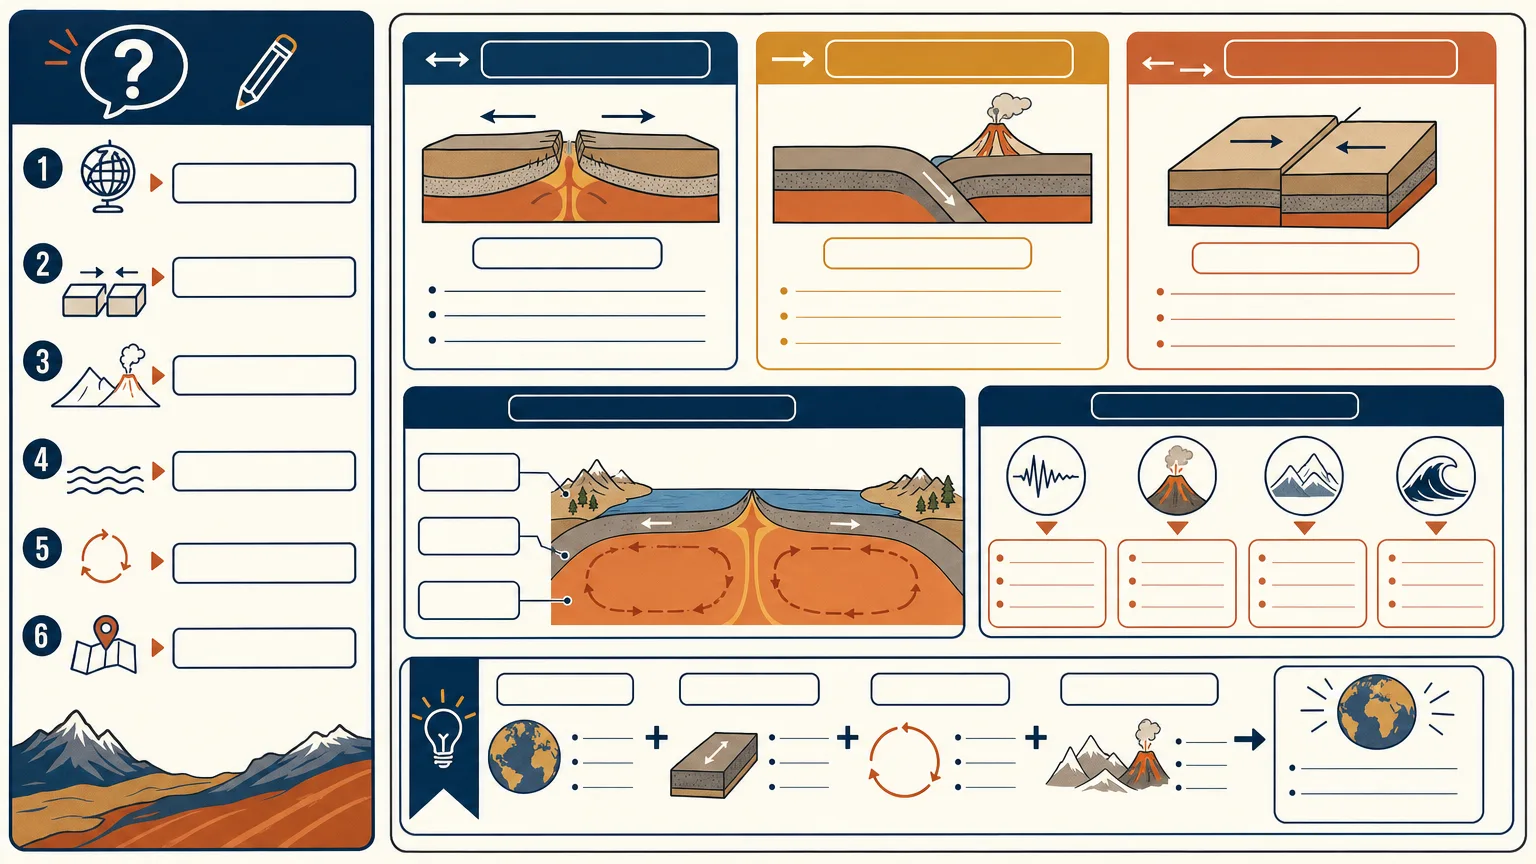
Three 16:9 cartographic composition alternatives focused on the regions needed for the story. The geographic scope and projection come from the approved base material, rather than a decorative map added without checking boundaries.
Comparable mini-profile charts with one shared scale, supported by a normalized table of region names/IDs, measures, units, scales, dates and sources. Missing and incomparable entries receive their own treatment instead of invented values or misleading visual equivalence.
Dedicated legend, citation and uncertainty zones, with exact geographic names and values typeset after base-image generation. The image model is not the source of regional scores, labels or sensitive boundary decisions.
A final check of borders/disputed areas, units, legend mapping and chart scales against the approved table, with an evidence/uncertainty handoff. Flavor profiles remain attributed to their method and source; the map does not settle geographic disputes or establish universal taste characteristics.
One paid FAL task requesting three high-quality 1536×864 PNG variants through the included wrapper. The script checks returned count only, with no GIS/projection, numerical-chart or factual validator. Exact geography/charts/typography and actual output dimensions require separate review and, where needed, deterministic composition.
Before you choose
Compare the mini-charts without looking at the map first: are their methods, units and scales actually comparable? Then inspect region placement and the legend. Geographic color should organize the evidence, not turn a subjective or missing value into a confident regional fact.
Good fit
A teacher needs a sourced regional comparison for a classroom explanation.
A science communicator can provide verified measures and wants their scope and uncertainty visible.
An analyst needs several comparable profiles in one map-led visual without hiding missing data.
Not for
Unsourced scores or values inferred from reputation, color or a region’s appearance.
Claims that subjective flavor profiles apply universally rather than to a stated dataset/method.
Sensitive boundaries or territories presented without cartographic review, or a map treated as an authoritative resolution of a dispute.
How to use
You say/regional-flavor-map Map my sourced profile data for eight fictional coffee-growing regions.
Provide stable region IDs, comparable measures/scales/citations, approved base geography/projection, audience, legend requirements and uncertainty notes. Resolve essential gaps or mark them for verification; do not invent scores.
Normalize names, values, units, scales, dates and sources into one table. Limit the map to the relevant scope and establish one mini-chart scale. Explicitly encode missing or incomparable data so absence cannot read as zero or an equivalent measurement.
Write a fresh English brief for unlabeled structure with source, legend and uncertainty zones. Keep geographic names and numeric values for later exact placement. Review the method/source attribution, projection/boundary treatment and exclusions before paying.
Use Node.js 20 or newer, a FAL account and FAL_KEY in the environment. One approved paid task requests three high-quality 1536×864 PNG variants. The text-only wrapper does not attach an approved basemap automatically or validate its projection; precise base geometry and quantitative charts need a separately controlled layout workflow.
Preserve provider-task.json and the prompt. A saved ID resumes with the same prompt/output directory; recorded failed tasks are not automatically resubmitted. Since the record follows the submission response, inspect provider history before retrying a lost response or failed write. Preserve reviewed copies separately because downloads can overwrite matching paths on resume.
Compare all three results against approved geography and data, including borders/disputed areas, region placement, chart scales, units and legend mapping. Check real ratio, distinction and unwanted branding/watermarks. Add exact names, values, citations and appropriate cartographic/method qualifiers deterministically; the script’s three-image count check is not evidence of map or chart accuracy.
Deliver reviewed compositions, final evidence table and unresolved uncertainties. Attribute subjective measures to their sources and avoid describing the artwork as a universal regional profile or authoritative geographic document.
Requirements and costs
You bring
Region list with stable identifiers · Comparable measures, scales, and source citations · Approved base geography and projection · Audience, legend requirements, and uncertainty notes
Image generation uses a paid fal.ai task. Review the prompt before submission; failed tasks are never submitted again automatically.
Publisher testing
v1.0.1 — Claude Code / Claude Desktop / Cowork / Codex / ChatGPT
FAQ
Stable region identifiers, comparable measures/scales, source citations and dates, approved geography/projection, audience and legend/uncertainty requirements. Missing values or incomparable methods remain explicit rather than being inferred from regional reputation.
No. Reserve clean zones, then place approved geographic labels, values, citations and disclaimers with a deterministic tool. Check chart geometry as well as text. The wrapper does not validate numerical scale, projection or boundaries.
It communicates the supplied dataset and method, not universal flavor facts or a settlement of geographic disputes. Sensitive boundaries need appropriate review and qualification. FAL_KEY and Node.js 20+ enable a paid three-variant base-image request, not cartographic or statistical validation.
User reviews
—0 reviews
Select a star to share your experience.
No reviews yet. Ratings appear once readers share real experiences.